

Climate
Associating the building with its place

Let’s start at the beginning. The Climate worksheet is the first of the ‘Building Inputs’ worksheets in PHPP and one of the first things to complete when getting started. The inputs are simple, but their impact is great. Here we look at why it’s important and find out how to fill it in correctly.

The data in the Climate worksheet gives us the local environmental conditions for the building. This isn’t just temperature, it’s also solar radiation (sunshine!) and humidity for the selected location, all of which are vital inputs for calculating the building’s heating and cooling demand, overheating risk and renewable energy demand.
A building in Spain will have a higher cooling demand and greater overheating risk than a building in Scotland, where space heating demand will be higher. Some climate zones (for example London) will have both high space heating demand (cold UK winters) and high overheating risk in summer (warm summers + heat island effect), meaning the prevailing conditions will demand different considerations at design stage. I recently heard this brilliantly described as London having a ‘three-dimensional climate’, and I bet there are plenty of other places that have similar challenges.
I think one of the best things about Passivhaus design is the promise of creating thermal comfort for occupants, with a steady indoor temperature year round delivered by the guiding principles of Passivhaus design (more on this in a separate article).
By selecting an appropriate climate data set we associate the building with its place. Instead of building an anonymous box that could be anywhere, we consider the specific environmental conditions and design the building to perform in those, optimising occupant health and comfort and reducing energy use in the process.
Understanding building performance against the Passivhaus criteria for the chosen climate data set identifies which factors stand out as the most important for building design. You can then focus on optimising these in the initial design stages.

The Passivhaus standard can be achieved in any location in the world, providing comfortable, healthy, efficient, low-energy buildings. To achieve this, each building is designed to meet requirements based on the local environmental conditions.
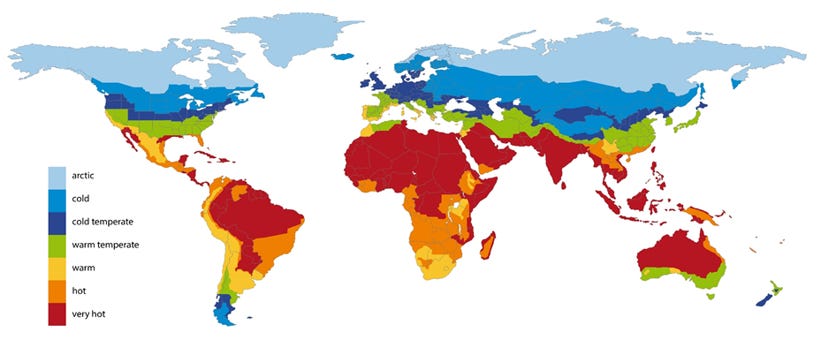
There are seven climate zones, from Arctic to Very Hot. At the extremes there will be a clear requirement for only heating or cooling, but for Warm, Warm Temperate and Cool Temperate zones a balance will be needed to achieve both summer and winter comfort and meet the Passivhaus targets.
The principal difference between climate zones is temperature, but solar radiation, humidity and dew points will all vary according to factors including latitude, site altitude and nearness to coasts.
Within the climate zones, the climate data sets can create very different conditions for building design, influencing factors such as U-values of the building fabric, space heating and space cooling demand or the need for mechanical cooling.
To demonstrate how sensitive building performance can be to the chosen climate data set, this chart shows a comparison of space heating demand and overheating risk for the five nearest climate data sets to a hypothetical Oxford, UK site. There is a 60% difference between the lowest and highest space heating demand figures, and a six times variation in overheating risk!
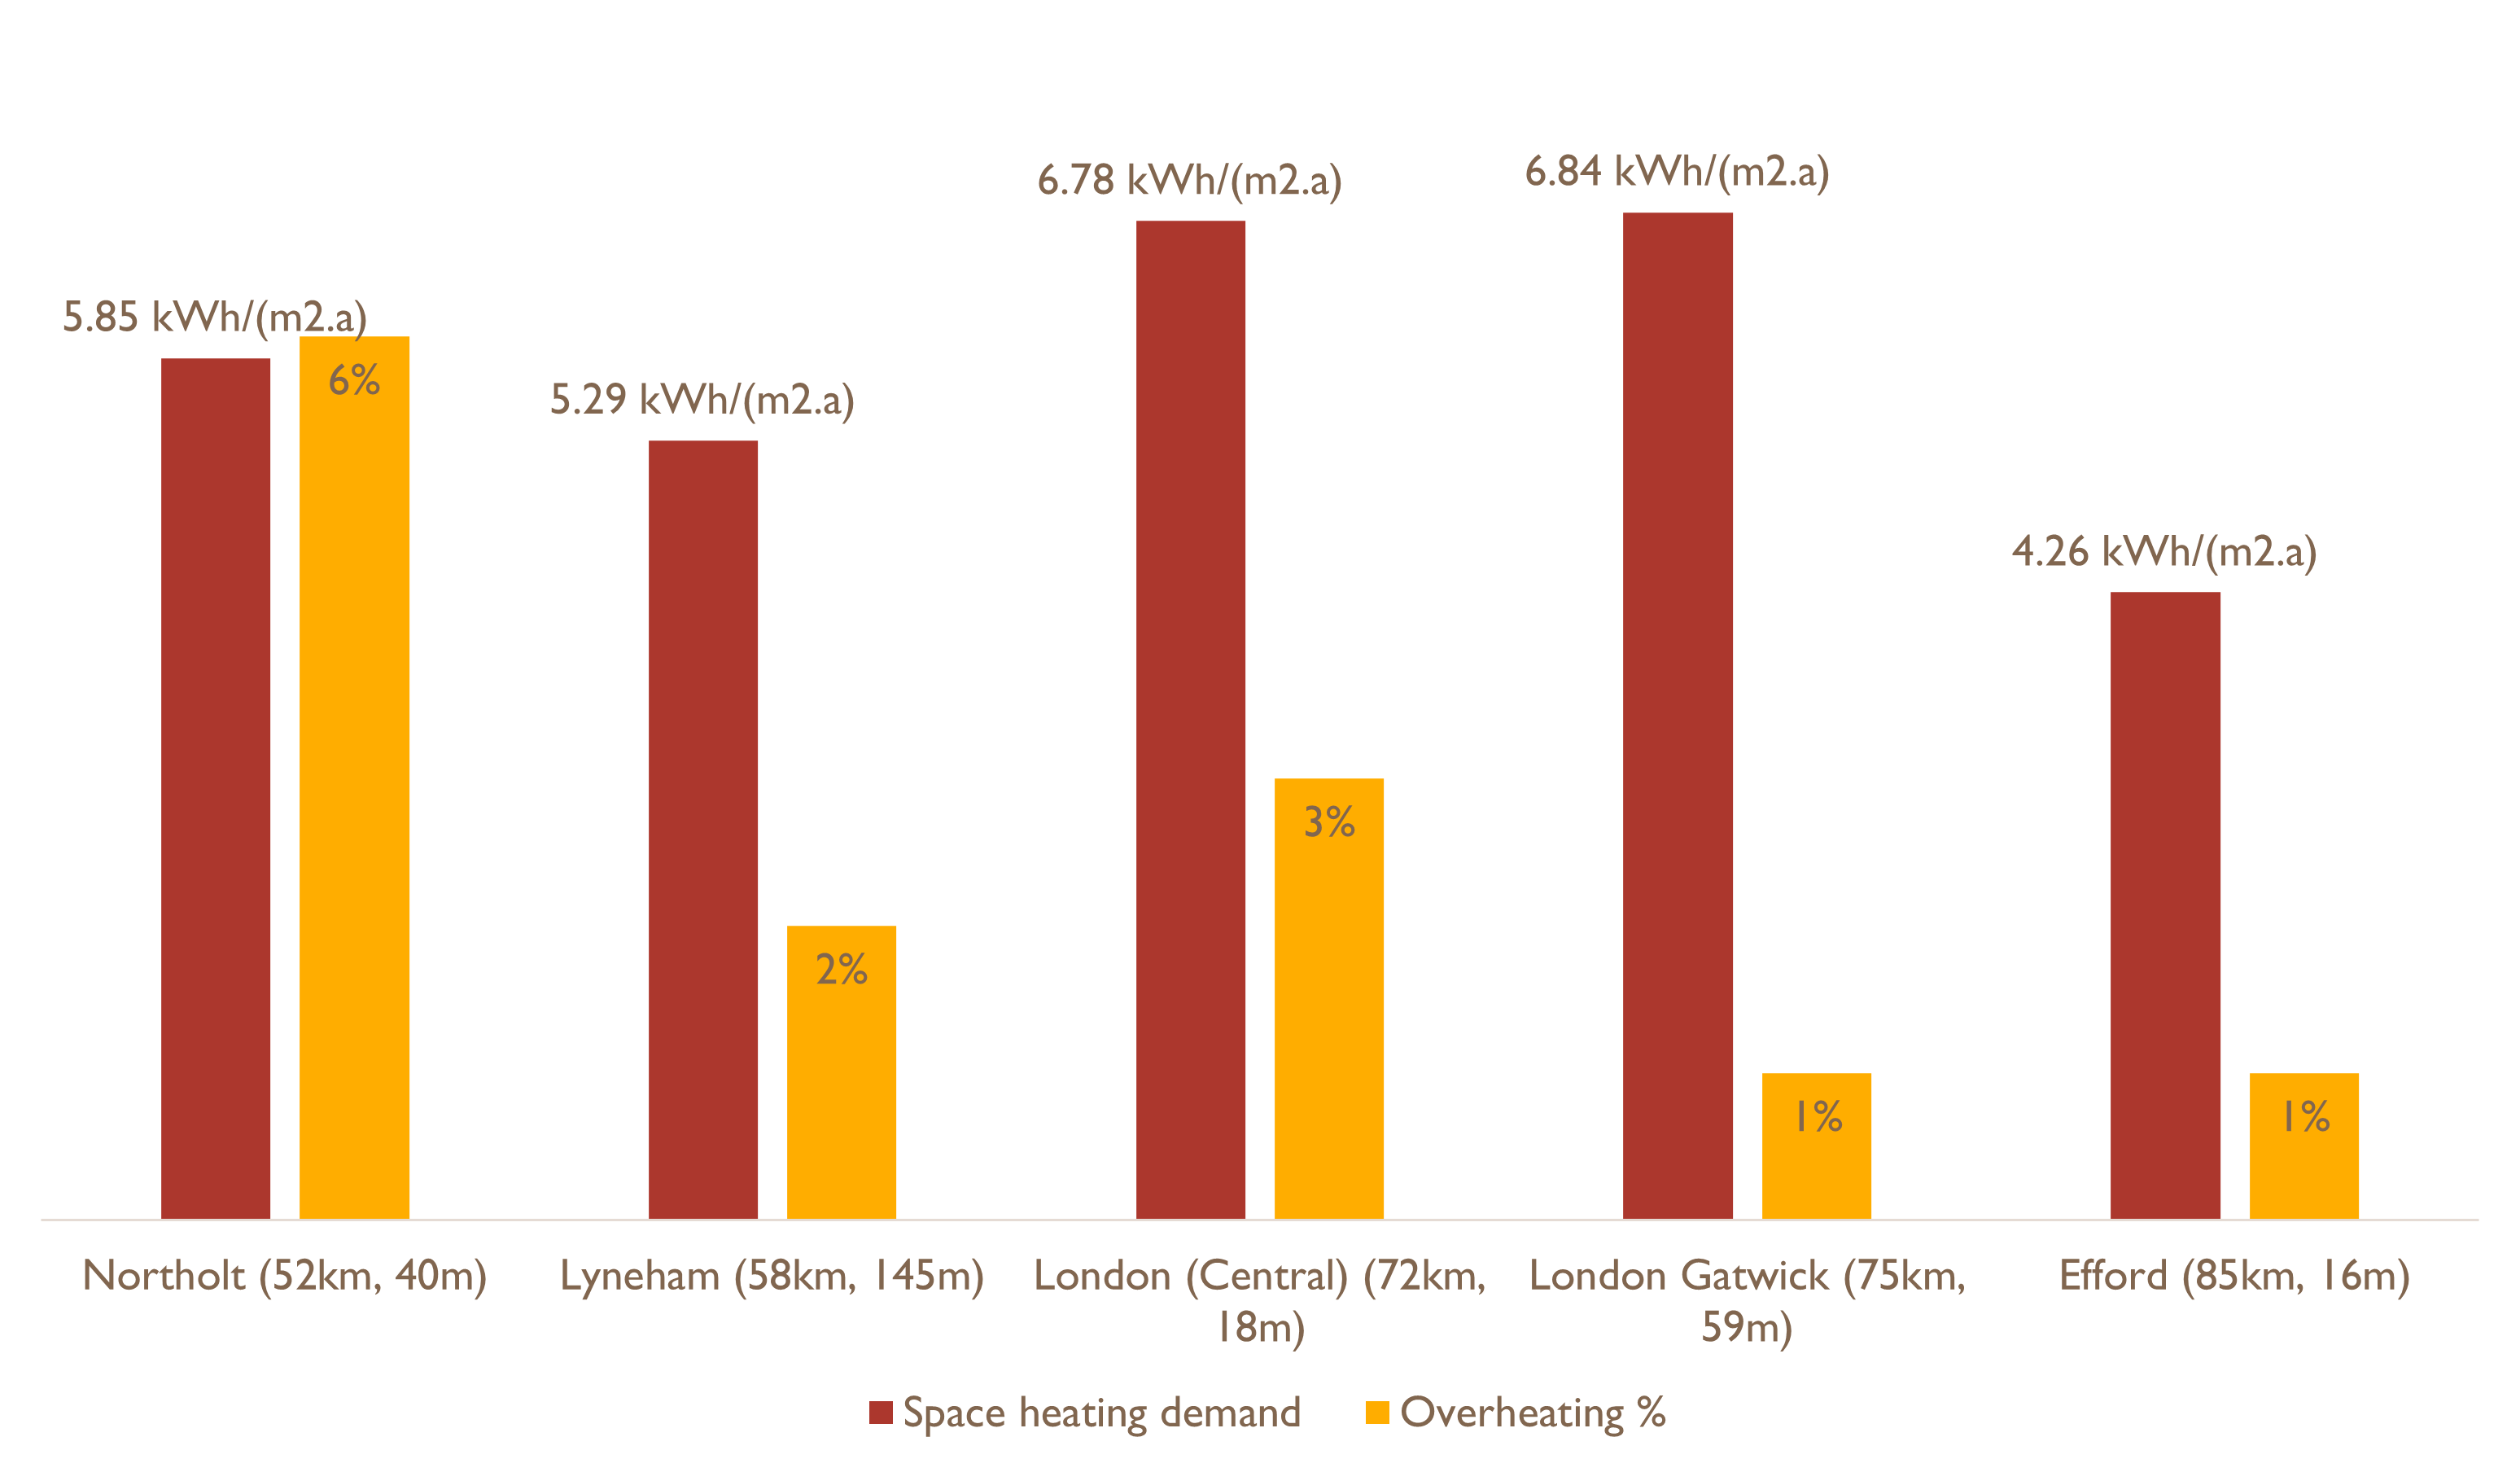
As you can see, depending on which climate data set is chosen, we will need to make different decisions when we’re designing this building, for example the amount of insulation / U-values, provision of temporary shading devices to mitigate overheating risk, or design of different building services.
Completing the Climate worksheet is a common source of error in PHPP, so let’s take a look at when and how to input the data.

The climate data set should be chosen as early in the design process as possible and its selection agreed as appropriate with your Certifier. This will ensure the finished building meets the Passivhaus criteria, is comfortable to live in and efficient to run.

There is an auxiliary tool in the Climate worksheet which identifies the five closest climate data sets to your site to aid decision making (see the ‘Where’ section below).
It’s not necessarily the case that the climate zone where the building is situated is the zone that should be selected due to factors such as site exposure, urban heat island effect or site altitude.
There are currently 1,140 climate data sets in PHPP (V10.6) covering 75 countries, arranged into dropdowns for ease of searching. Some countries are divided into regions with multiple climate data sets within, whilst other countries include only a single climate data set. If there is no appropriate data set for your site your Certifier can request a new file from the Passive House Institute (there may be a cost for its creation), or agree which existing climate data set to use for design and certification.
There are options to input your own user-defined climate data and also to apply a summer increase (I’ll cover these in a later article); both are useful for stress testing a design (e.g. can overheating due to urban heat island effect be effectively mitigated). However, these adjustments cannot be used in the final PHPP model for Passivhaus certification, only the built-in climate data sets may be used.
Selecting the climate data set
There are several ways to choose a climate data set for your building:
Choose based on nearest available climate data set:
If available, use the country map or lookup table in section 14.5 of the PHPP10 manual
Use the auxiliary calculation to find the nearest data set, see below
Seek a recommendation from your Passivhaus Certifier - they will have experience of similar projects / locations and can advise on the most suitable. They will also have the final say on which climate data set is appropriate for Passivhaus certification, so it’s worth seeking their advice or, better still, providing them with your recommendation for approval
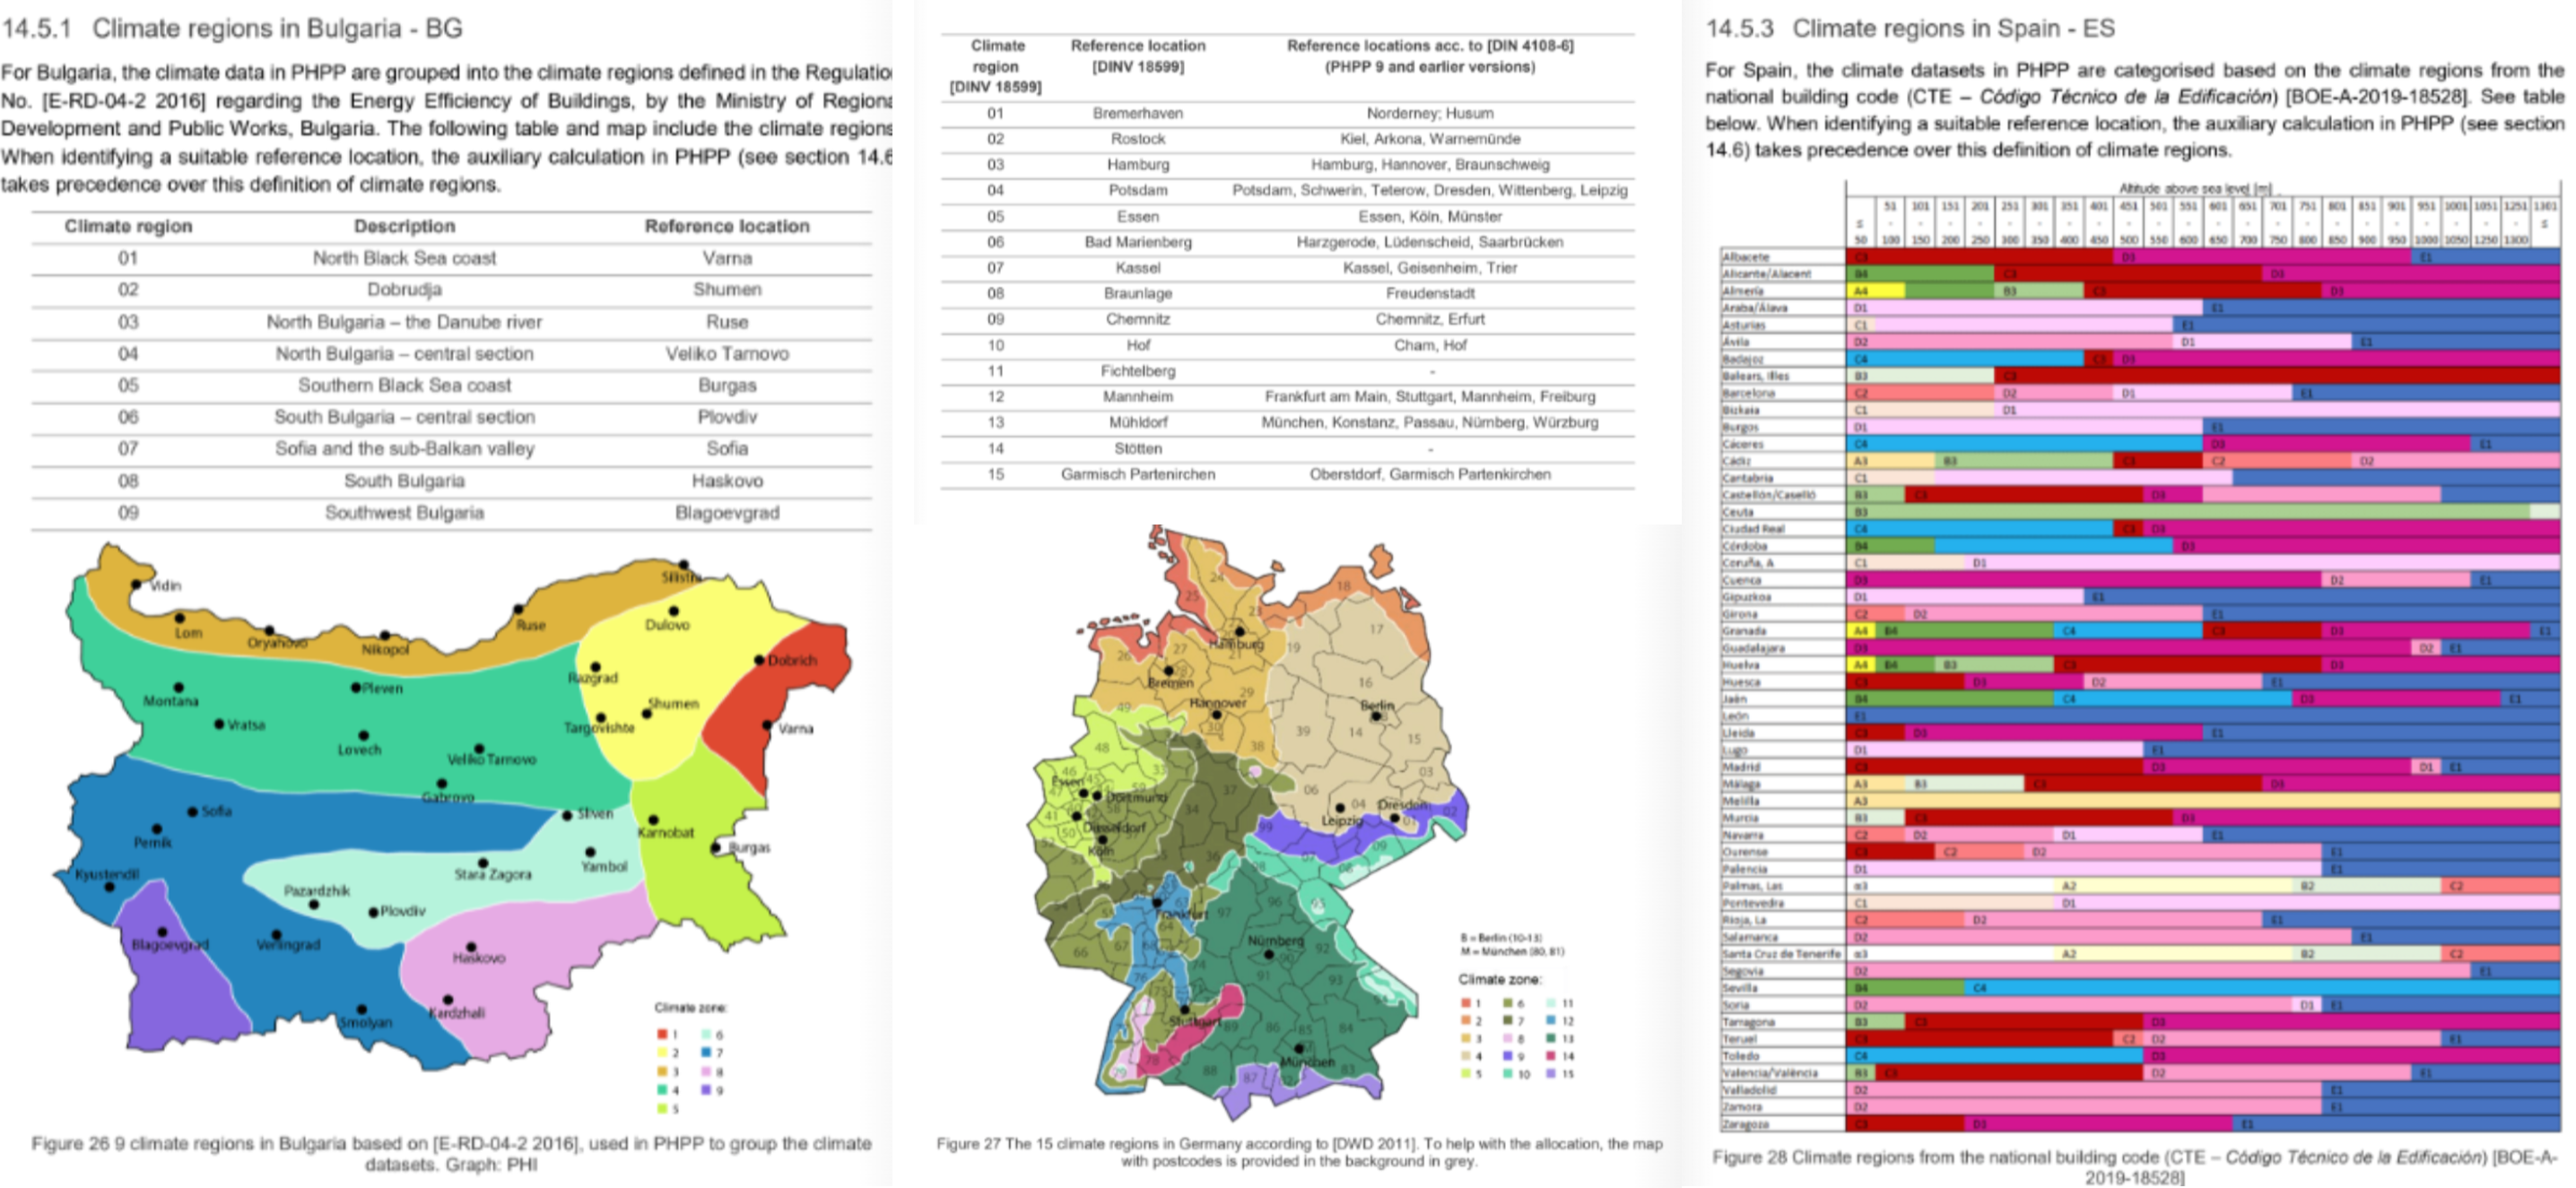
Country maps / tables
Maps and / or lookup tables are available in the PHPP10 manual for many countries; examples below are Bulgaria, Germany and Spain.
Auxiliary calculation
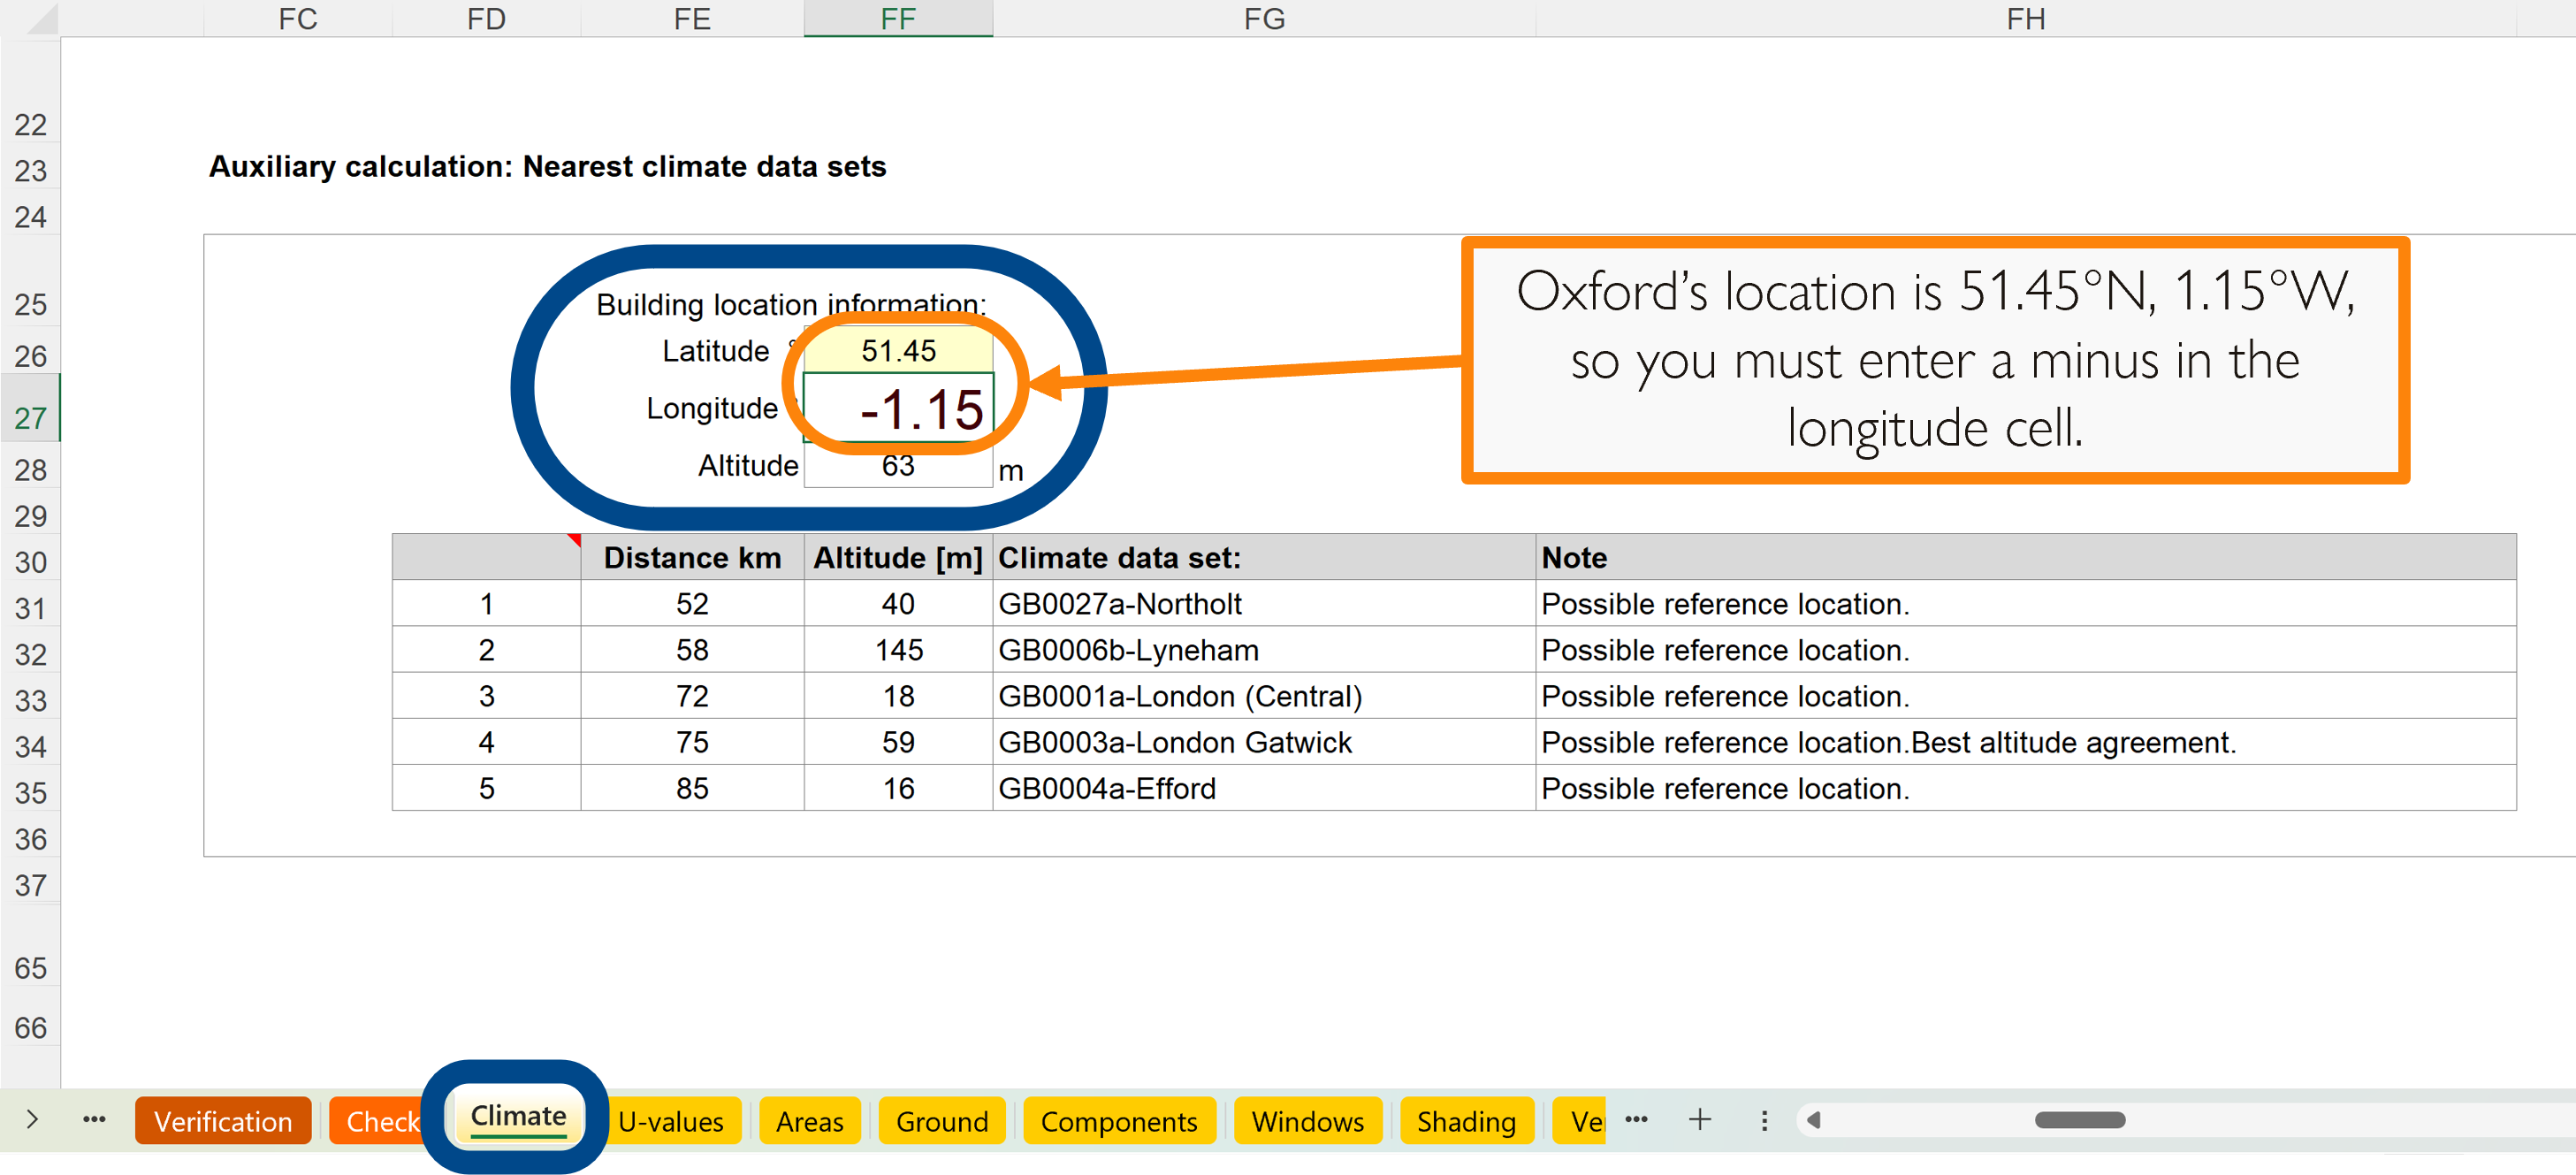
To find the nearest climate data set to your site, you can use the auxiliary calculation in the Climate worksheet, which is on the right-hand side of the worksheet from column FC.
The longitude and latitude are expressed in PHPP using decimal degrees; this differs from some online mapping tools (including Google Earth), which use degrees in a given direction. You therefore need to exercise caution when entering the data into the auxiliary tool:
Degrees north and east are entered as positive numbers
Degrees south and west are entered as negative numbers
The example below shows Oxford, which is 51.45°N and 1.15°W, which is entered as 51.45° latitude and -1.15° longitude.
If you get this wrong it will probably be obvious, as you’ll find unexpected locations being suggested. In the case of Oxford, if 1.15° is entered instead of -1.15° you go east instead of west and end up with locations in northern France!
For our location in central Oxford the nearest climate data set is Northolt. This also has reasonably good agreement with our site’s altitude, so we’re going to use this data set.
How to find site altitude, longitude and latitude
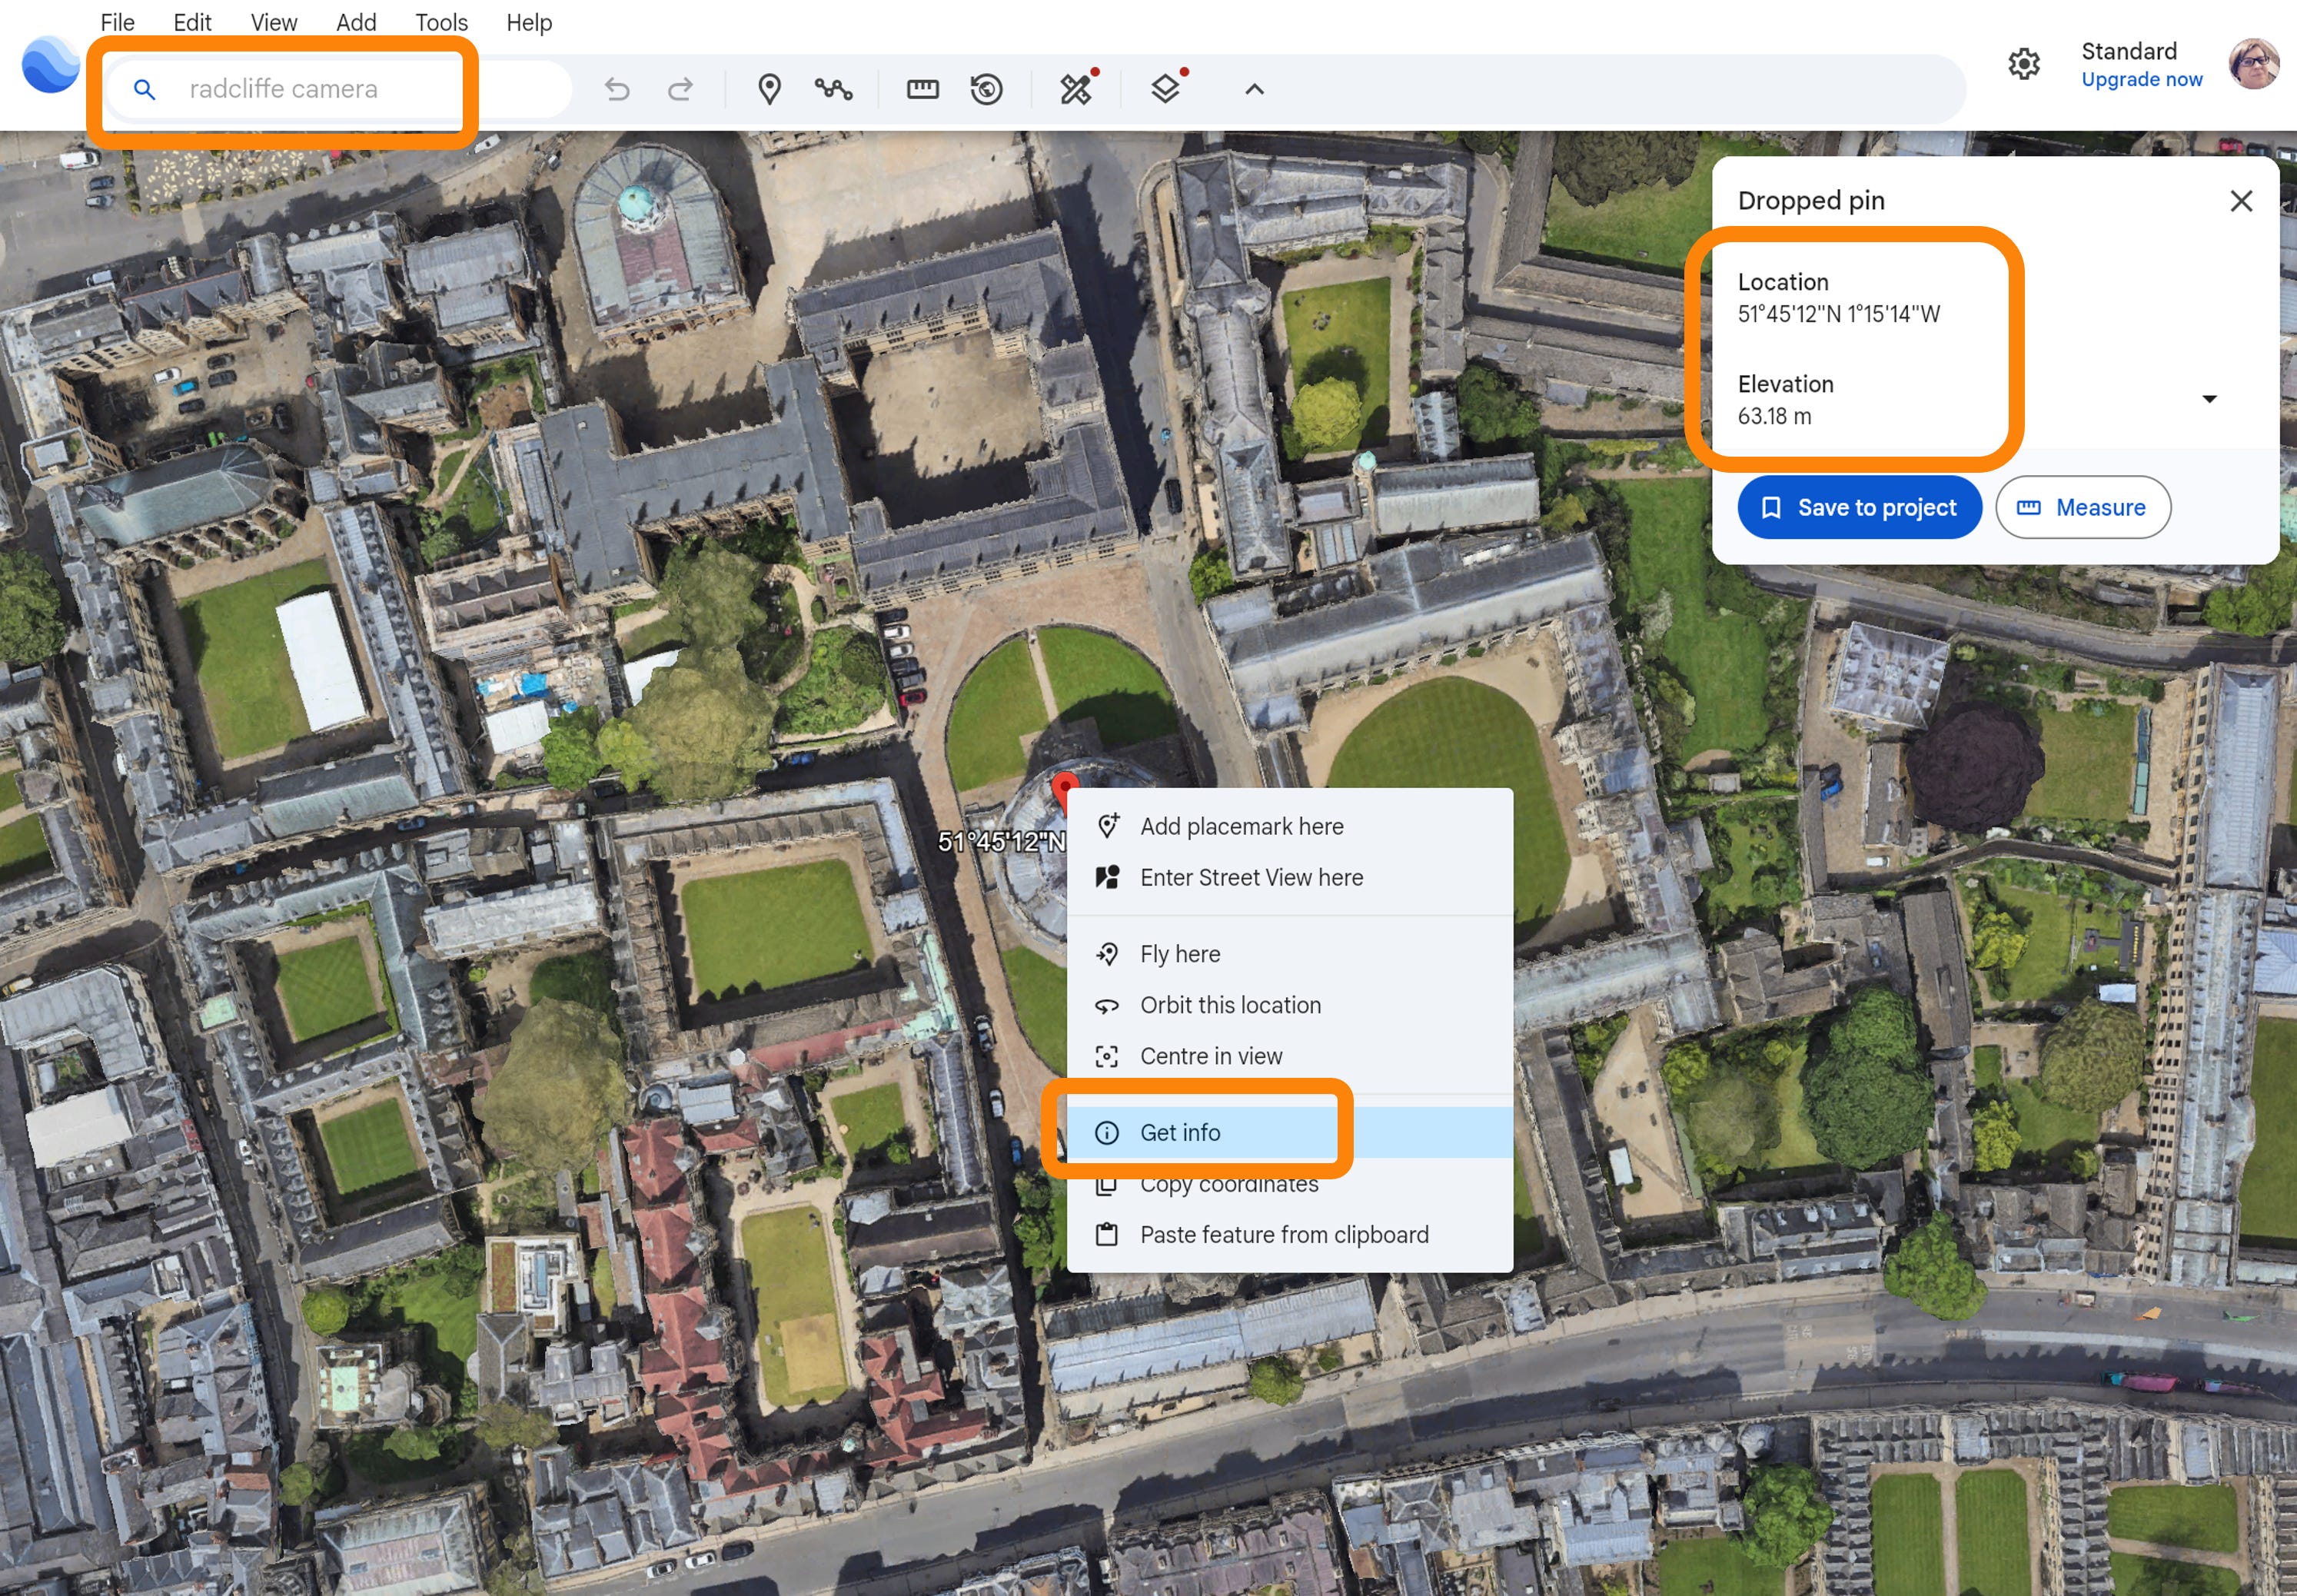
Use Google Earth to find your site’s elevation (altitude), longitude and latitude. Here’s an example for the Radcliffe Camera in Oxford, with a video demo below.

I’m going to focus on a UK example as I’m in the UK. The first stumbling block you’re going to come across is finding the UK in the dropdown list of countries!
In PHPP V10.6, the UK is at the bottom of the ‘Country’ dropdown list and is labelled in German as “GB-Vereinigtes Königreich”. If you’re looking for Northern Ireland you’ll find it as a Region within the GB country list: ‘Zone 22 - Northern Ireland’.
Inputting the climate data set
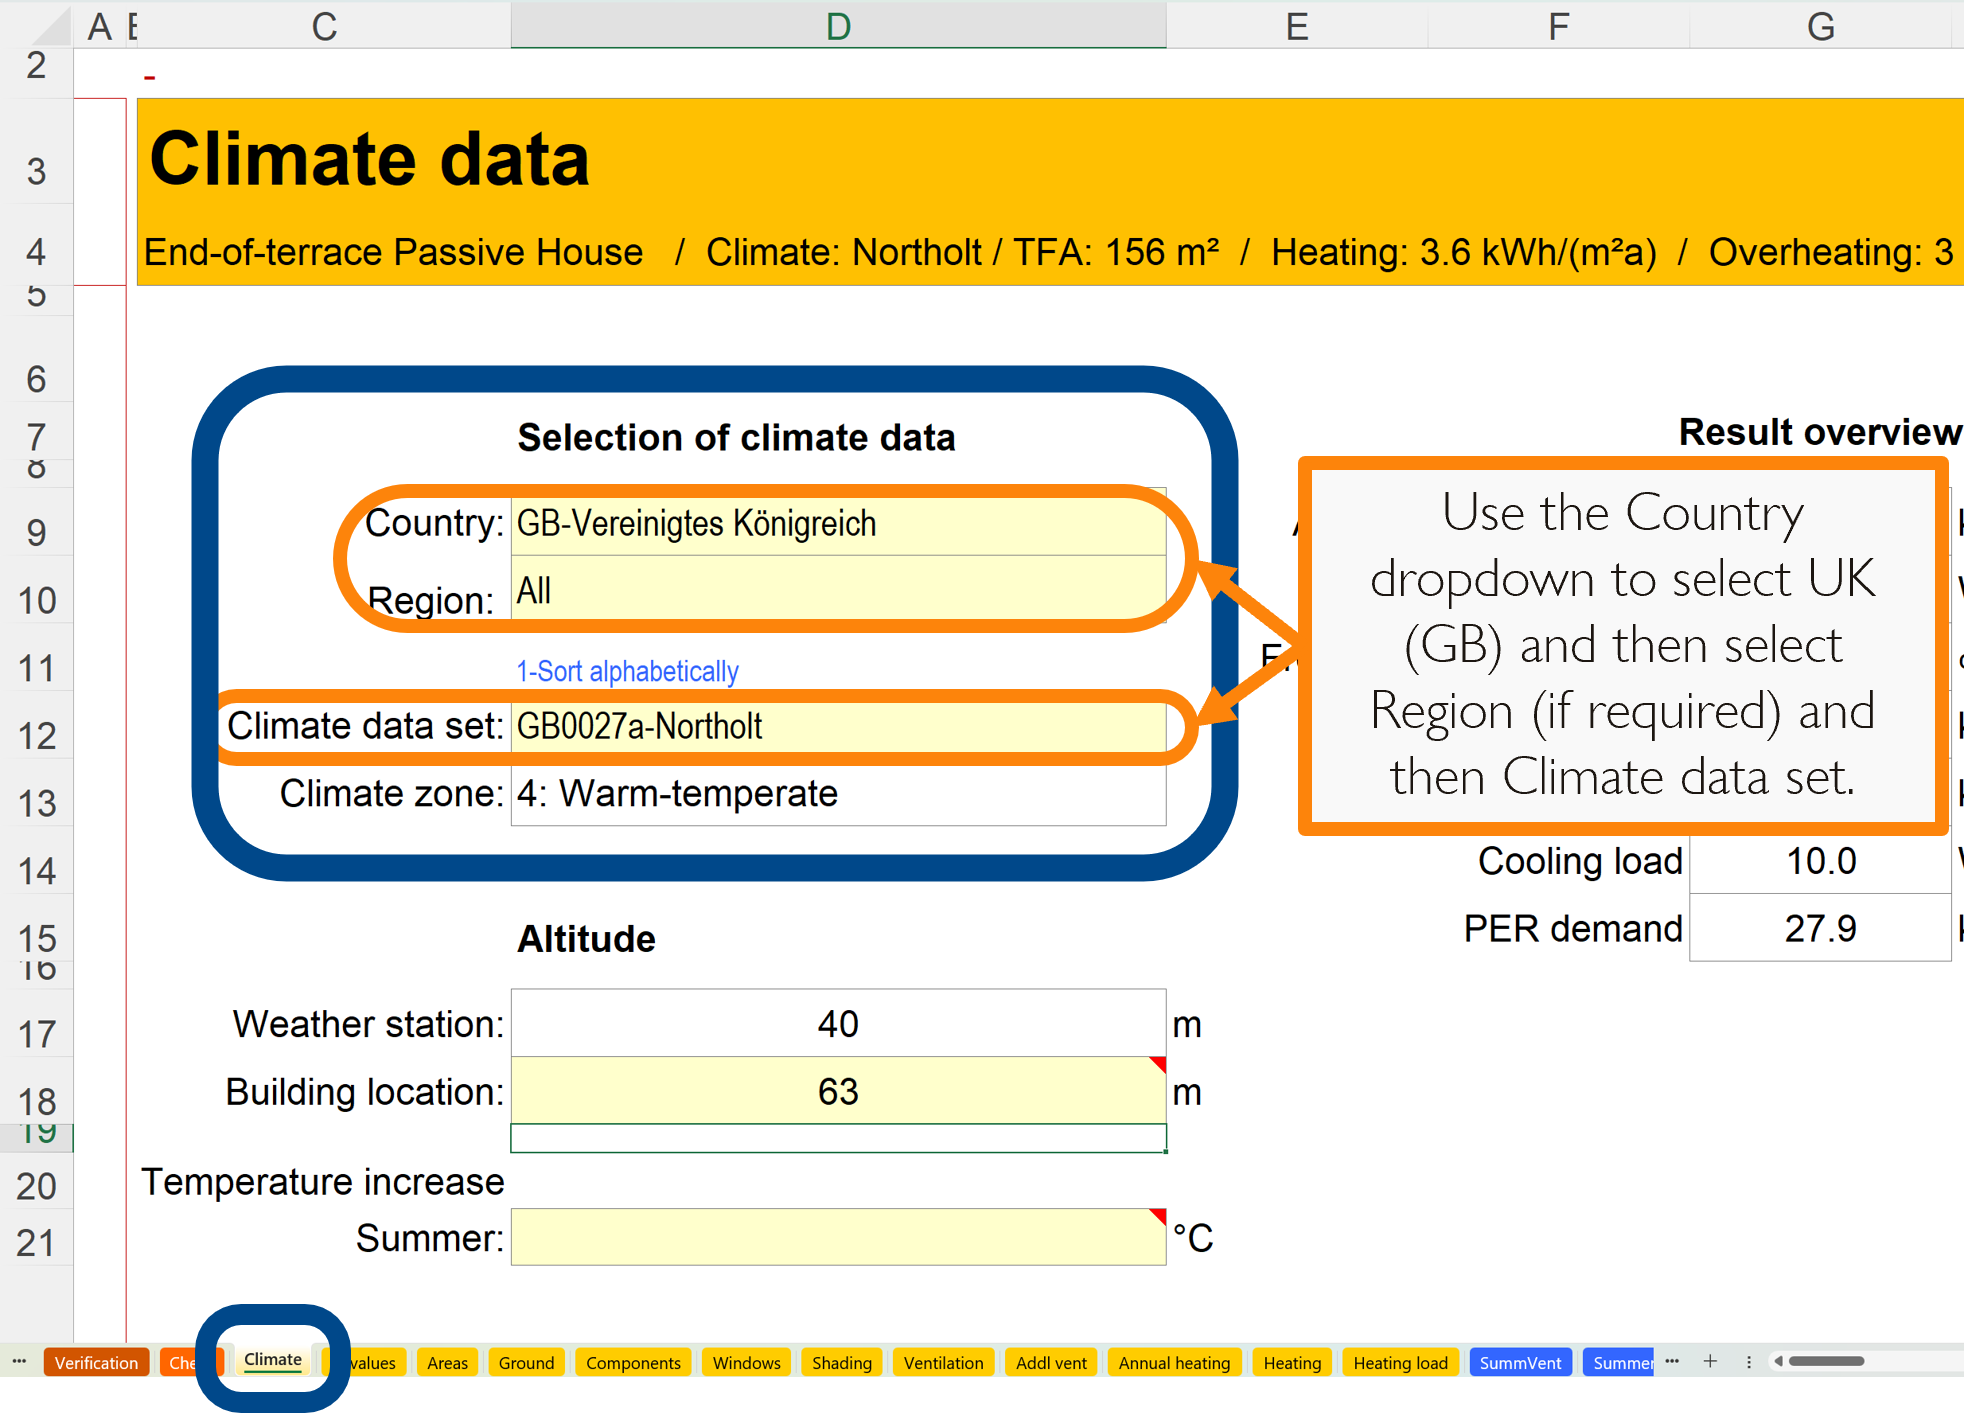
In the Climate worksheet, select the Country, Region and Climate data set for your chosen location (cells D9, D10 & D12). If there are multiple regions and climate data sets you can just select the chosen Climate data set from the dropdown list and leave ‘Region’ set to ‘All’.
Setting site altitude:
The site altitude may vary from the climate data set altitude, so we set the site altitude in cell D18 of the Climate worksheet, and PHPP uses the difference to adjust the exterior and dew point temperatures to recalculate heating and cooling demand.
For an extra 100m of altitude PHPP reduces temperature given in the climate data set by 0.6K (0.6°C), so care should be taken in selection of climate data sets that have different altitudes to your site as there may be a significant difference in climatic conditions. In this case a different location may be more suitable, even if it’s further away.
A note for tall buildings:
As you might expect, as you go up tall buildings, the prevailing conditions will change from ground level. For this reason you should add half the building height to the site altitude for any buildings taller than 100m (about 30 storeys).
A note for cooling dominated climates:
In Warm, Hot and Very Hot climate zones there are additional inputs required on the Verification worksheet to tell PHPP there will be mechanical cooling in use. We’ll cover this in a separate article.

Hopefully you now know how to select the most appropriate climate data set for your PHPP, which defines the performance criteria and guides design decisions for your building.
WHY: To associate the building with its place, allowing the design to account for the prevailing environmental conditions
WHEN: At the earliest design stage, including confirmation with your Passivhaus Certifier
HOW: Using the most appropriate built-in climate data set
WHERE: In the Climate worksheet

Passivhaus Preceptorship bridges the gap between qualification and practice by guiding and mentoring you through your first Passivhaus projects. If you find this content valuable, please help spread the word by sharing.

Keep up to date with all our latest posts by subscribing and have a peruse of all the posts in our archive: